
Brand marketing is moving to the center of the CMO agenda for 2026.
Teams want clearer proof of brand momentum, stronger signals of demand, and a way to defend long term investment. Setting up Share of Search and brand marketing analytics is becoming a must-have, not a nice-to-have.
Below are the most reliable ways to measure brand marketing today.
The top methods to measure brand marketing
1. Build it yourself with MyTelescope
A full view of real interest. Share of Search, monthly acceleration, themes, and pattern analysis. Ideal if you want ongoing, privacy-safe brand measurement that plugs directly into planning and reporting.
2. If you prefer brand tracking as a service, work with specialists
Storybook, Inversion agency, Publicis, and Likehouse can run the full tracking workflow for you. They combine structured demand signals with your brand KPIs and deliver a managed readout.
3. If you want a simple manual option and can accept limited detail, Google Trends
Free and directional. Good for quick checks, but not sufficient for proper Share of Search, category frameworks, or competitive depth.
4. If you want raw data inputs, use Semrush or Ahrefs
Useful for keyword-level exploration if you are ready to build your own definitions and logic. These tools provide data, not a full brand measurement system.
Share of Search: The Moment It Deserves
It really feels like Share of Search is having its moment — finally recognized as one of the most powerful, accessible, and foundational marketing metrics we have.
Recent work from WARC highlighted a standout case study from adidas, where the brand committed to Share of Search as a core measure. Tracking over 100 brands, they found strong and consistent correlations between search and sales — clear proof that market interest shows up first in what people look for.
Kantar has now added more weight behind the metric, showing a 90% correlation between search and brand salience. That validation from one of the world’s biggest measurement firms signals that Share of Search has firmly moved from an interesting idea to an accepted standard.
Through the Storybook platform, I’ve seen firsthand how Share of Search translates beautifully into B2B. It captures early buying intent not just awareness across startups and enterprise brands alike. It gives leaders a real-time sense of where demand is building and how their brand is positioned in that conversation.
It’s important to remember this metric isn’t new. James Hankins and Les Binet laid the groundwork years ago, and their research continues to prove its staying power. What’s changed is the context: marketers are once again investing in brand, but traditional tools aren’t keeping up. Attribution models don’t explain long-term effects, surveys are expensive and slow, and econometrics is often out of reach for smaller brands.
That’s where Share of Search shines. It’s simple, proven, and scalable. Small brands can use it just as effectively as large ones, and it can be built to fit any budget. It’s democratized brand measurement — a way for anyone to see and act on real market signals.
There’s something refreshing about a metric that’s both rigorous and accessible, one that works just as well for niche markets as for global players. The energy building around it right now is exciting, and the work platforms like Storybook are doing to make it easier, faster, and more actionable feels like the start of something even bigger.
If you want to track your brand in B2B, go to Storybook.
If you want to do it yourself, use MyTelescope.
And if you’re looking for a large research partner, Kantar is now championing the metric too.
There are more and more ways to measure Share of Search today — and that’s the best sign yet that it’s finally getting the attention it deserves.
Best Share of Search Tools: Which One is Right for You?
Measuring Share of Search is one of the best ways to track brand awareness and market demand, but choosing the right tool can be challenging. Whether you need full control, automation, or SEO insights, the platform you select will determine the depth and accuracy of your market analysis.
In this article, we compare the top contenders:
Fully Automated with Full Control: MyTelescope
Fully Automated but No Control: Google Trends
1. MyTelescope – Best for Market Analysis & Share of Search
✅ Full control over data
✅ Beautiful dashboards for easy reporting
✅ AI-powered assistant for follow-up questions
✅ Automated competitive tracking against key rivals
✅ Purpose-built for Share of Search and brand awareness
✅ Only platform with automated tracking and dashboards
MyTelescope is the only tool specifically designed to track brand awareness via Share of Search. It is fully automated, meaning it continuously updates search data without requiring manual input—something competitors lack.
Competitive Tracking with MyTelescope
A standout feature of MyTelescope is its automated competitor analysis. It tracks your brand’s Share of Search versus key competitors, helping you spot shifts in consumer interest in real time.
With its AI-powered assistant, you can ask follow-up questions to explore trends and uncover deeper insights. The automated dashboards present the data in a clear, visual format, making it easier to report findings to stakeholders.
🚀 Only MyTelescope provides automated tracking, dashboards, and AI-driven insights.
Best for: Brand tracking, market analysis, competitor intelligence, and Share of Search insights.
2. SEMrush – Great for SEO & Digital Marketing
✅ Comprehensive SEO toolkit
✅ Excellent for tracking backlinks and website traffic
✅ Well-established in digital marketing
❌ No automated dashboards or tracking
SEMrush is a powerful tool designed for SEO professionals. While it includes some search trend data, its primary focus is on website traffic, backlink tracking, and competitor research for digital marketing.
Competitive Tracking with SEMrush
SEMrush offers competitor analysis for SEO and paid search, but not for brand awareness tracking. Its competitor insights focus on website performance rather than consumer demand.
🚨 Downside: SEMrush is highly technical, lacks automated dashboards, and requires manual work to track trends over time.
Best for: SEO experts and digital marketers who need website traffic insights.
3. Ahrefs – Best for SEO Optimization
✅ Deep SEO optimization tools
✅ Strong competitor analysis features
✅ Focused on backlink research
❌ No automated dashboards or tracking
Ahrefs is a powerful SEO tool, offering competitor analysis for keywords and backlinks. However, it lacks Share of Search tracking and does not provide automated updates or dashboards.
Competitive Tracking with Ahrefs
Ahrefs excels at analyzing backlinks and keyword rankings but does not offer automated Share of Search tracking. You’ll need to manually collect and analyze data to understand market shifts.
🚨 Downside: Ahrefs is great for SEO professionals, but without automated dashboards, tracking, or Share of Search insights, it’s not the best choice for brand analysis.
Best for: SEO optimization and competitive analysis.
4. Google Trends – Quick Insights, But a Black Box
✅ Fast and free
✅ Great for spotting broad search trends
❌ No automated dashboards or tracking
❌ Lacks transparency and data control
❌ Cannot track specific competitors easily
Google Trends is a quick and free way to explore search interest, but it has major limitations when it comes to Share of Search tracking.
Competitive Tracking with Google Trends
While Google Trends allows you to compare search interest between brands, it does not provide automated tracking. The lack of dashboards makes it difficult to visualize trends over time, and its data remains a black box with no transparency on methodology.
🚨 Downside: Google Trends is useful for basic trend spotting but not for serious competitor tracking or brand awareness analysis.
Best for: Casual trend-spotting but not in-depth market analysis.
Conclusion: Which Share of Search Tool Should You Choose?
If you need a fully automated, AI-driven solution with dashboards and competitor tracking, MyTelescope is the clear winner. It is the only tool that automates Share of Search tracking while offering full control over data analysis.
For SEO and digital marketing, SEMrush and Ahrefs are excellent choices, but they lack automation for tracking brand awareness. And if you just need quick trend insights, Google Trends might work—but expect no control, transparency, or automated tracking.
💡 For serious brand tracking, competitor analysis, and Share of Search insights, MyTelescope is the best choice.
Share of Search analysis
The viability of Share of Search as a method has been a subject of growing discussion. Adidas, a prominent company, has adopted Share of Search as its primary marketing metric, surpassing the limitations of NPS. Share of Search not only provides trend insights but also offers valuable clues about its effectiveness.
Our members at MyTelescope have authored a comprehensive guide on utilizing Share of Search for market and business intelligence analysis. Here's a summary, and for more details, please visit their blog:
Executive Summary: Share of Search Analysis for Market Intelligence
Share of Search analysis is a potent method for obtaining crucial market intelligence. This concise summary highlights key points:
Share of Search provides insights into online visibility and competitive positioning.
It helps identify trends, customer preferences, and market shifts.
Define objectives, select keywords, identify competitors, monitor search engines, and utilize tracking tools.
Analyze data to benchmark against competitors, spot trends, understand customer behavior, identify market gaps, and refine strategies.
Share of Search analysis guides marketing, product development, and resource allocation decisions.
It's an ongoing practice to stay updated with industry trends and adapt strategies for a competitive edge.
Share of Search validation
Our partners at MyTelescope have over the years created validation studies on Share of Search and Market share. Download the here if you need them to sell in the KPI internally.
The consequences of reducing marketing budgets on future sales
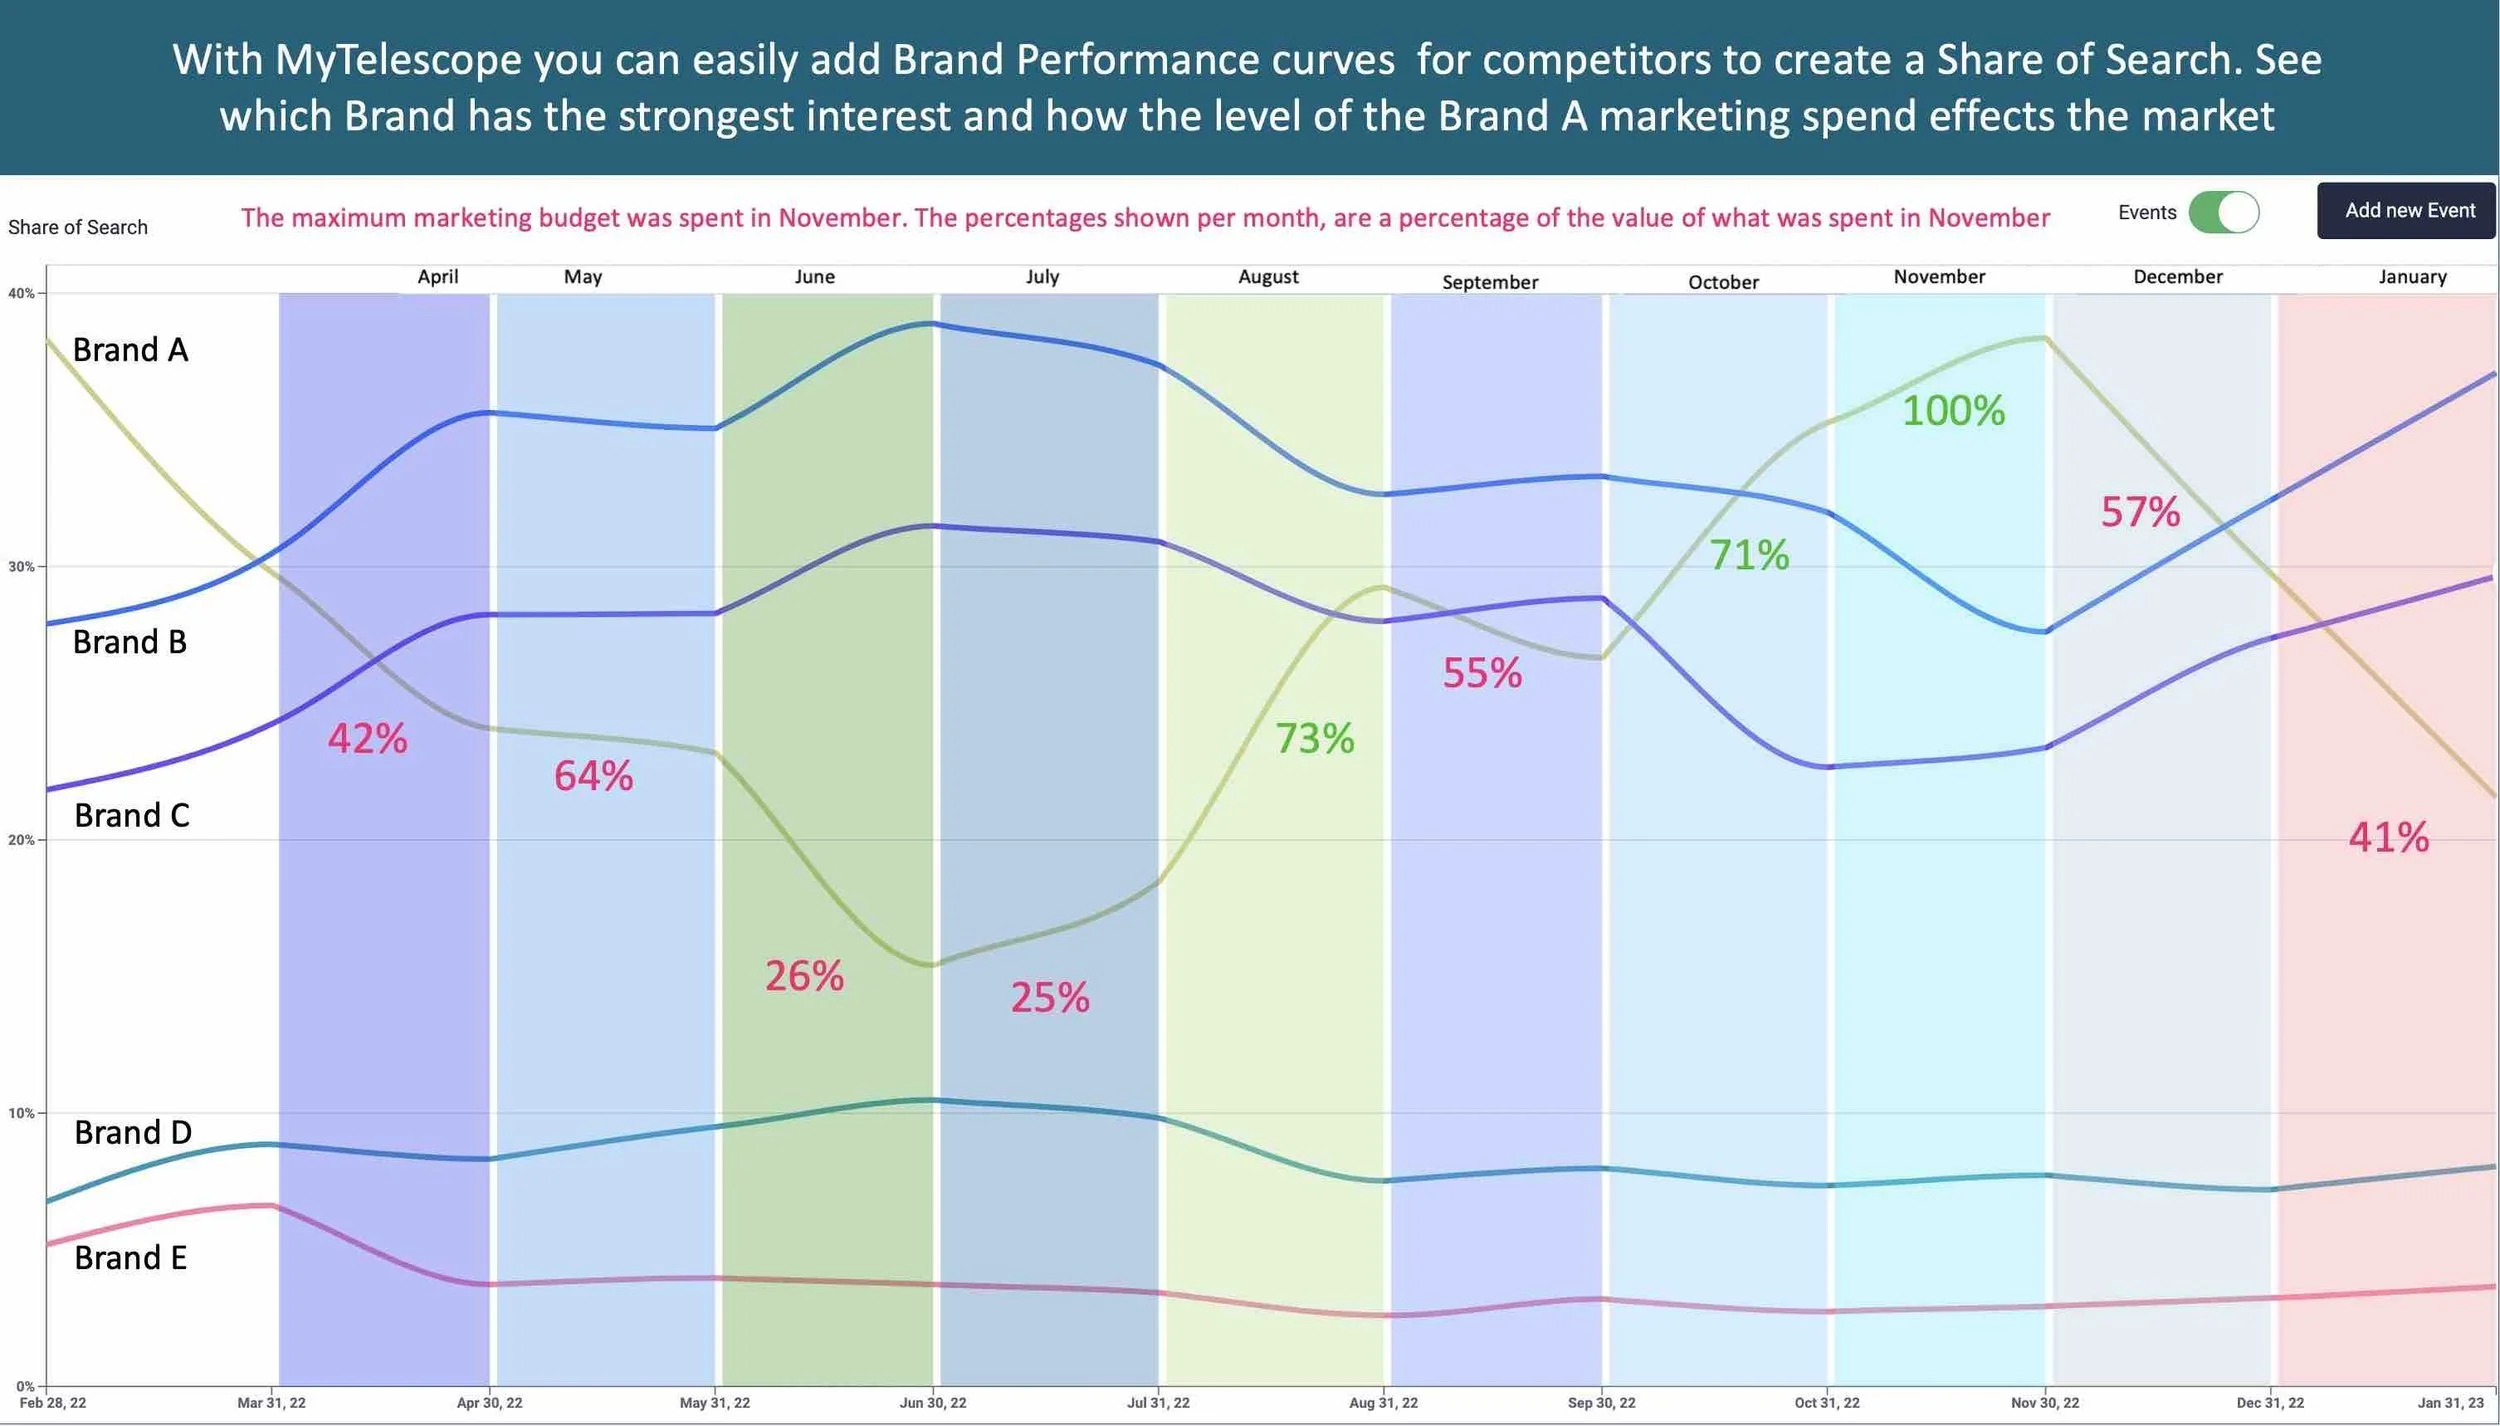
Search interest data strongly correlates with market share, although the lead time for sales and market share predictions varies by category. For instance, we can see the effects of budget decreases resulting in diminished brand performance within the medical care sector. In assessing the extent of this outcome, it is crucial to benchmark against industry rivals, thereby determining whether the brand has experienced declines in consumer interest and its prospective market share.
Understanding the level of search interest in the brand and how that relates to the level of search interest in the brand's competitors underscores the need for a delicate balancing act between marketing initiatives and financial stability.
Read more here on how to Forecast your future sales
Share of Search vs conventional Brand Trackers
Share of Search correlates extremely well with brand trackers.
SoS also has some powerful advantages over traditional brand trackers:
You have access to data from far back in time. Even for your competition.
You can change your mind and redefine the category, your competition, period, region or other metrics at any point. Or make multiple comparisons.
You can drill down into tiny categories.
You may even study the share on product level
The data is for free!
10 lessons on how to track your brand with Share of Search

Share of Search is great tool to track brand strength. But there are many aspects to keep in mind. Here are our best tips.
RESEARCH RELAY
Analysts and researchers around the globe may have the chance to share how they explore new trends and follow brands in the data era. The writer passes the baton on to someone they are inspired by.
The baton is now in the hands of Share of Search Council member Robert af Klintberg Ryberg:
“Share of Search” (SoS) is an excellent method for analyzing customer interest and predicting sales and market share changes. However, as I have written about before, the technique has some challenges. But applying a few learnings can easily make SoS work at its best.
What can Share of Search tell us?
We at Kapero have been using Share of Search in several cases when analyzing all aspects of a marketing department, to find opportunities to improve organization, processes, and effectiveness. We have learned that it is a most useful metric.
1. There is a clear link to future sales in the short term. An uptick in search interest points to increased sales within three weeks to six months, depending on how fast-moving the category is.
2. There is a clear correlation to brand strength slightly longer term. We’ve seen this in every project we’ve applied “Share of Search” to. Furthermore, there is a correlation between a change in brand strength and market share. We have so far not seen any examples that contradict this. So, we could call this “Share of Brand”.
Short-term impact on sales (1) is perhaps most valuable for forecasting supply.
Instead, we are primarily interested in growth within the category and how market share changes. Therefore, we look mainly at how the interest for the brand changes (2). But how best to study this with “Share of Search”?
Here are ten lessons we have learned:
· It is the long-term trend that is important to study to see if there are indications that the brand (market share) is growing or if there are indications to the contrary.
· Like regular brand measurements, real change happens in 1-2 years. You, therefore, don’t need to update the measure very often.
· Study averages over time (full-year, half-year or possibly quarterly). Variations and rapid fluctuations make it difficult to read the graphs and the variations occur for many reasons that are hard to analyze and interpret. Rapid fluctuations are usually unimportant for growth and change in market share towards a strategic time horizon. Averages also increase the reliability of the somewhat coarse data Google provides.
It is important to consider the relative change, not just the change of percentages in the diagram.
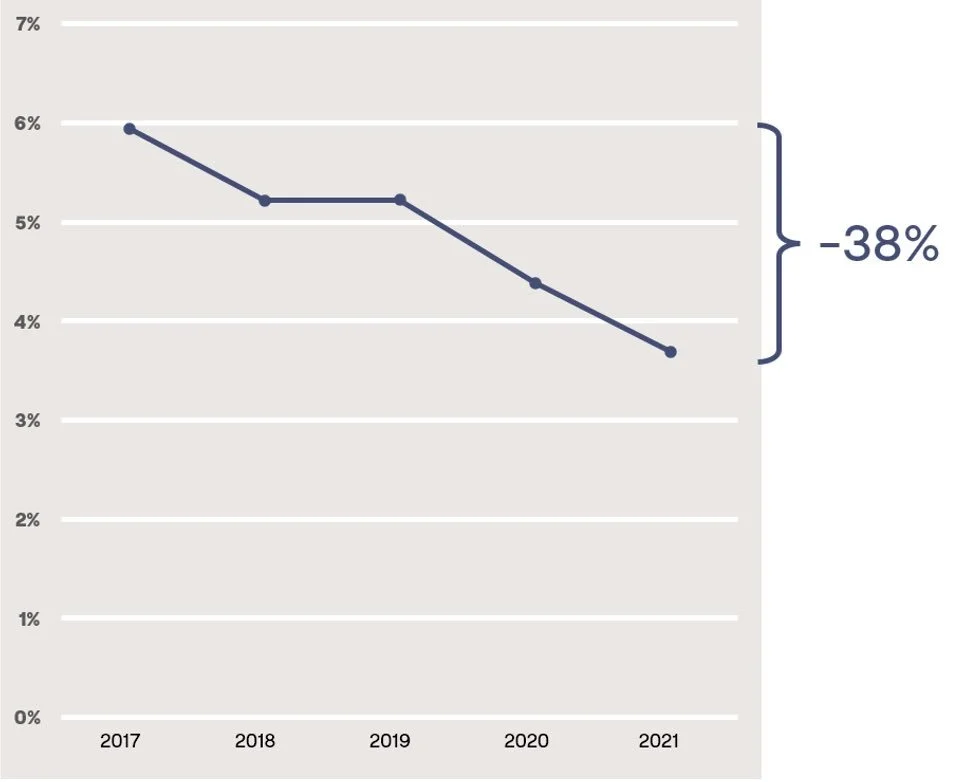
Focus on your brand’s relative change. An increase from 1% to 2% in Share of Search may seem insignificant but is, in reality, growth by 100%! Or a decrease from 6% to 3,7% is a relative loss of 38 % as in the image above.
Select the competitors against who you want to study your share. This can often be difficult, primarily if your competitors operate in multiple categories. Therefore, define a clear category. Buy you may want to follow multiple such definitions.
If competitors also operate in other categories and you don’t want to contaminate your measurement with their strength (market share) in those other categories, you can combine the brand name with the product type you have in common. For example, combine “Bosch” and “washing machine” and compare with “Samsung” and “washing machine”.
If the product category is tricky to define, you can even combine the brand with the name of actual products. Be aware that you also need to do this in the same way for the competitors you are comparing with to get reliable data.
You can add up search volumes for several such combinations of terms. This can be a good method of narrowing down to a specific product category and increasing search volume so that it becomes reliable.
Try out different set-ups. You can always create comparisons with various competitors and possibly word combinations, with varying selections of categories, geographic regions, periods, and anything else you want to study. Test where you get good, reliable data, what competitors to disregard and what terms to combine. You can always change your mind later since you have the historical data is there for you and all your competitors.
Consider significant adverse search interest. This is mainly done to correlate major adverse events (e.g. media scandals) with visible changes in the SoS. Here, quarterly or monthly averages may need to be studied to assess the impact. In our experience, it takes pretty significant events to impact SoS for established brands. Research also shows that over time these adverse events usually have a little sustainable impact on the brand.
Also, remember to avoid the pitfalls - there are quite a few. Especially for smaller brands (see my previous article). https://www.linkedin.com/pulse/share-search-rarely-savior-many-brands-hope-af-klintberg-ryberg/
Now – go on exploring your Share of Brand!

Today we are launching:RESEARCH RELAY
RESEARCH RELAY
Analysts and researchers around the globe can have the chance to share how they explore new trends and follow brands in the data era. The writer passes the relay on to someone they are inspired by.
The first one is on us, though.
So, we are proud to present Alexander Vucic a brand strategist from Uppsala, Sweden.

RESEARCH RELAY - Alexander Vucic
"I believe that one of the biggest hindrances for share of search is that people don’t fully understand or trust the data.
Not that people are stupid, we are just not used to it. It was not too long ago that we as marketers used to trust brand surveys to 100%, since there was no other way to track your brand. These surveys were usually done with panels that are used for many different surveys and the participants usually get some kind of compensation for it. There has always been a discussion about how trustworthy the result from a survey like this is. But now when there is a new way of tracking your brand, marketers are a bit reserved to it and some haven’t even heard of it. Is this due to the lack of time to learn new things, or is it a matter of “when brand X are looking into it, we will too”, or something else?
I have no answer to this question, but what I do know is that Google alone processes 63.000 search queries every second worldwide, EVERY SECOND!
That is about 5.6 billion searches every day, for myself these numbers is getting stupidly big and unmanageable for my mind to try to comprehend the full extent of it. Do you feel the same? Don’t even try to multiply that with 365.
Ok, sorry I did it, it’s two trillion and forty-four billion searches every year.Here comes the interesting part, instead of paying some survey company money for tracking your brand in one exact moment of time. You can now see the history of how your brand has developed, and the best part is that the data you are using for it is the data that the consumers put into Google in the time of need, not because someone asks them to think of a brand. So I would say that the data we are looking at to get our share of search for different brands is authentic and pure."
Alexander passes the relay on to Mats Rönne, Mr Efficiency in Sweden.
Stay tuned!
Track with data that correlates with market share
I meet many a ‘brand manager’ that has no brand tracking, at least none that is less than 12 months old, and I always politely point out this means they aren’t really brand managing anything”. Mark Ritson,
The problem with brand tracking has been to prove that the results from the brand tracking actually correlate to the bottom line. Now with Share of Search analytics you have a data set that has an average correlation of 83% to market share and bottom line.
By conducting brand tracking you get an understanding if the money you are investing in your brand building is paying off.
This means that if you don’t track your brand you are actually not managing anything.
Share of Search is not Google Trends
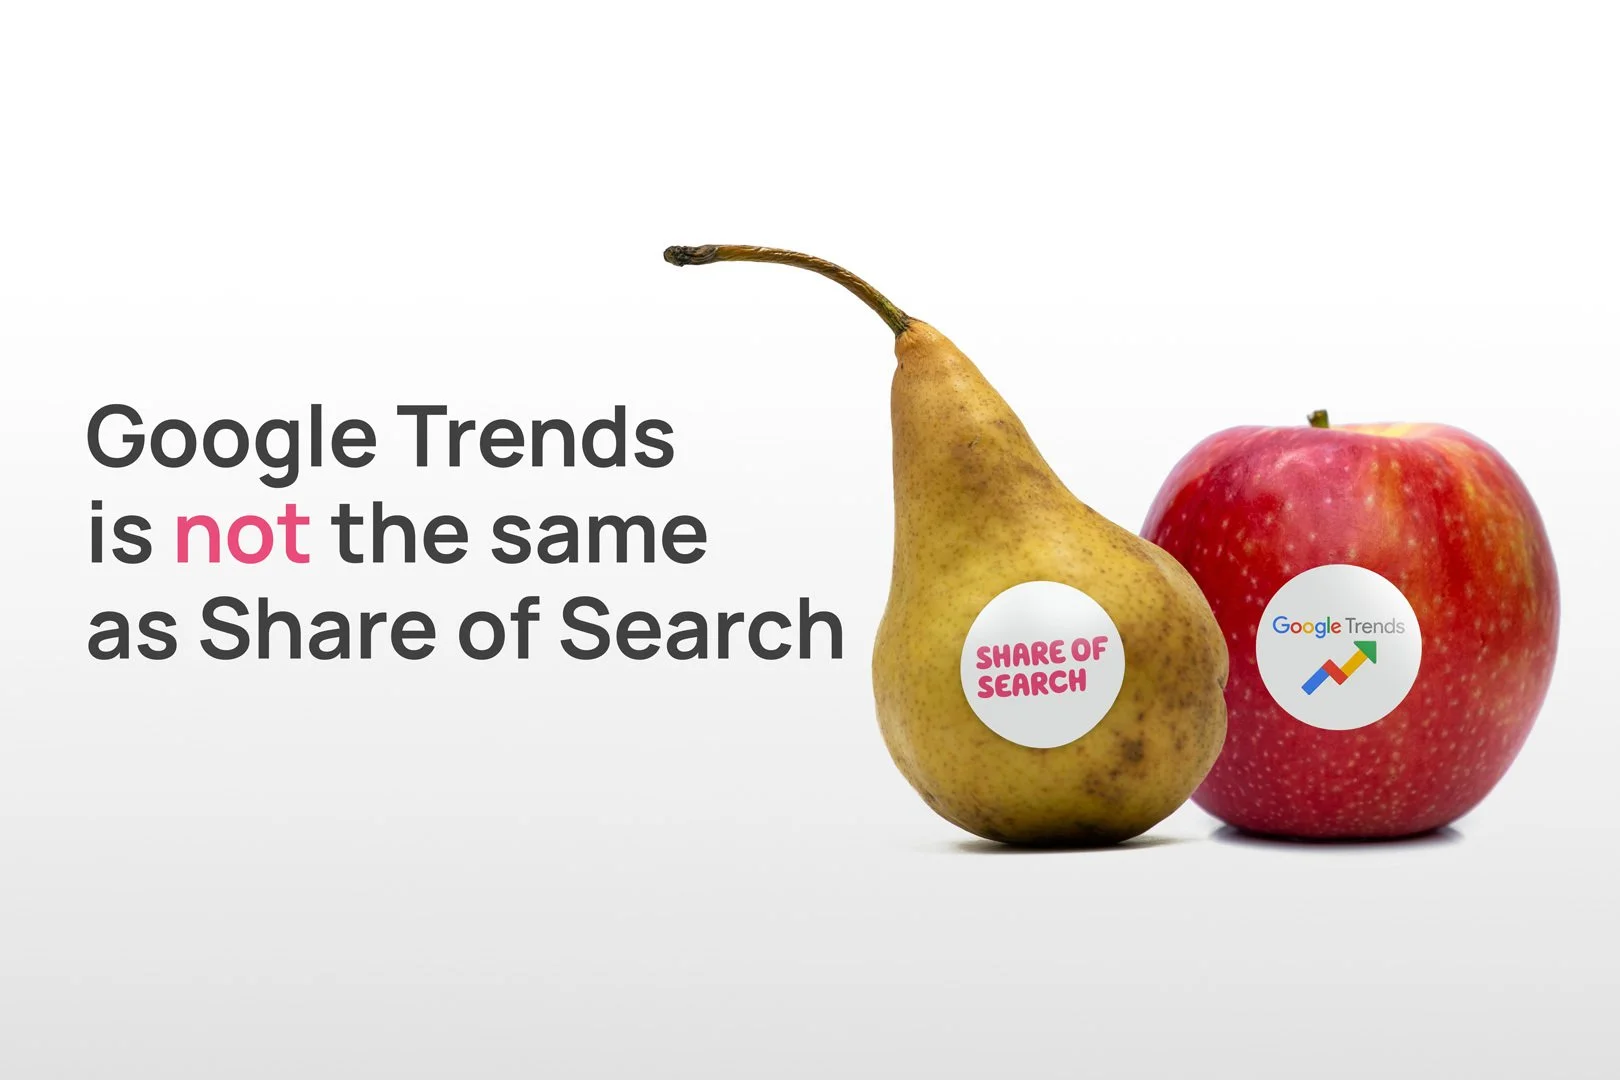
A common misconception on Share of Search
The concept of Share of Search is gaining popularity, but with new concepts also come new misconceptions. In this article we’ll debunk one, but let’s s make sure we all start from the same page.
The idea behind Share of Search is simple: we compare how many times people actively thought about us in comparison to other brands, knowing from Byron Sharps studies that this overflow of mental availability will lead to increased sales given our product or service is easily accessible.
That’s it? Yep, and most people will use the simplest tool in the world to get that overview: Google Trends…..which is exactly leading to the biggest misconception with this new metric.
The data of Google Trends is useful to identify changes in search volumes between brands within shorter periods and mainly to see how quickly a new trend picks up. However, it is not ideal for finding correlations towards sales. Those who dive deeper into it and actually start investigating the correlations in depth, often are left with little to find. Google Trends, if anything is therefore better to investigate the reaction for marketing campaigns and trends, instead of relation to sales.
Here is why Google Trends isn’t the ideal dataset to run market share correlation:
Indexed:
The Google Trends results are indexed, meaning a change in search volume from one week to another can completely shift the historical values. Furthermore, the selection between the brands is also very important.Randomised:
The data that are shown are based on samples taken from the time period you selected. This makes the data unstable as the exact same search merely 10minutes apart can lead to totally different results.Keyword selection:
Google Trends will request whether you want to look at the search term or the categorisation. For example Unilever as search term of “retail”. This selection will also generate different results. Furthermore, our research has shown that rather seldomly the direct brand name will show any strong correlation to the sales results or market share.
Use Monthly search levels
Instead, the use of monthly search volumes proves to be far more effective and have a much higher frequency to show correlation. Especially when being able to select various keywords to look for the correlations. Something that can easily be obtained by various tools including the Share of Search analytics tool My Telescope.
But wasn’t the original research done with Google Trends data?
The original research by both Les Binet and James Hankins was indeed done using Google Trends data, their approach was different from what most people discovering Share of Search do. Here are the main differences:
Long time series:
Les’ automotive research, kicking off Share of Search, was done over a period of 13 years. This meant he had both search and sales figures for a rather extended period. Most people using Google trends now, don’t have the sales numbers over such long time periods.12 month rolling averages:
Given the long time periods they were able to use 12 month rolling averages, taking out most fluctuations and more stable lines.They looked at long term trends:
Unlike most people using Google Trends and expecting to find similar curves in both search trends and sales, Hankins and Binet looked at long term trend lines in both data sets that showed clear correlation.
So if you want to look for correlations between Share of Search and market share or sales on shorter time series: use search volumes, select the right search words and look at trend lines.
Use Share of Search analytics to predict demand
Search data helps keep you up to date on the market pulse (no cookies required). On average, 69% of what drives the demand can be understood by analyzing Share of Search.
The benefits of search data goes beyond a SEO-focused keyword research. It is a valuable resource for both market and product research and plans.
Thanks to Share of Search the business value of brands can easily be proved
There are 4.66 billion active internet users worldwide* making the internet the world's largest panel of consumer behaviour
81% of all purchase decisions come after a search.
On average there exists a correlation of 81% between companies’ branded searches and future sales and market share*
*Statista 2021
*IPA Share of Search working group 2021
SoS = SoM across category, country and languages – 83% avg. correlation
This week Share of Search was at the top of the agenda at the IPA’s (Institute of Practitioners in Advertising) annual Effworks and it is quickly becoming the must have metric.
James Hankins presented the findings of a joint study regarding the relation of Share of Search with market share, media spend, and even mental availability.
The study, included over 30 case studies across 12 different categories spread over 7 countries and confirmed Share of Search’ as a proxy to market share.
Key Findings:
Share of Search confirmed proxy for market share:
https://www.marketingweek.com/share-of-search-market-share
Share of Search proves relevance of TV:
https://www.marketingweek.com/rightmove-strength-in-search/
Share and Search Mental availability
Share of search correlates to mental availability
What is Share of Search
The answer is very straight forward: The relative interest for a search term in relation to a defined set of search terms.
So how does this matter when you are understanding the market and gathering market Intelligence?
What research by Les Binet and James Hankins has shown is that there is a correlation between what we search for and a final outcome. That can be commercial success, trends, building or the outcome of marketing investment in building strong brands.
Branding as an investment in Growth
Companies and organizations worldwide spend approximately $700 billion annually on marketing, media, research, creative etc., to influence and change people’s behavior.
Until now, the effect of these spendings has been hard to measure. Thanks to digitalization, we can now analyze behavioral data to understand why people do what they do and think what they think.
My Telescope helps decisions makers understand and track those behavioral signals, helping them make more educated decisions, and turn spendings into investments.
The world’s 40 strongest brands generated almost twice the total return to shareholders (TRS) over the course of the 20-year period ending in 2019. Source McKinsey, 2020)

Until today there has been no proper way to measure the branding activities impact on bottom line and market share. The opportunity for branding and the marketing function is to start thinking line an investor.
CMOS ADOPT AN INVESTOR MINDSET
Successful investors seek to maintain a healthy amount of liquidity so that they can rebalance their portfolios nimbly as market conditions or other circumstances change. The longer an investment is expected to take to pay off, the more risk it carries. In the same vein, marketers with an investor mindset take a risk-adjusted view and penalize certain investments that will take longer to generate a return. They determine hurdle rates based on the expected returns each potential communication investment can generate, relative to the current and constantly fluctuating price. To take an extreme example, the absolute and relative return on investment expectations would result in a much higher hurdle rate for an investment in a five-year professional sports league sponsorship than for next week’s search-bidding strategy.
To make sure you win both in the long and the short play use Share of Search

Is SHARE OF SEARCH – THE ARGUMENT FOR NOT CUTTING MARKETING BUDGETS?
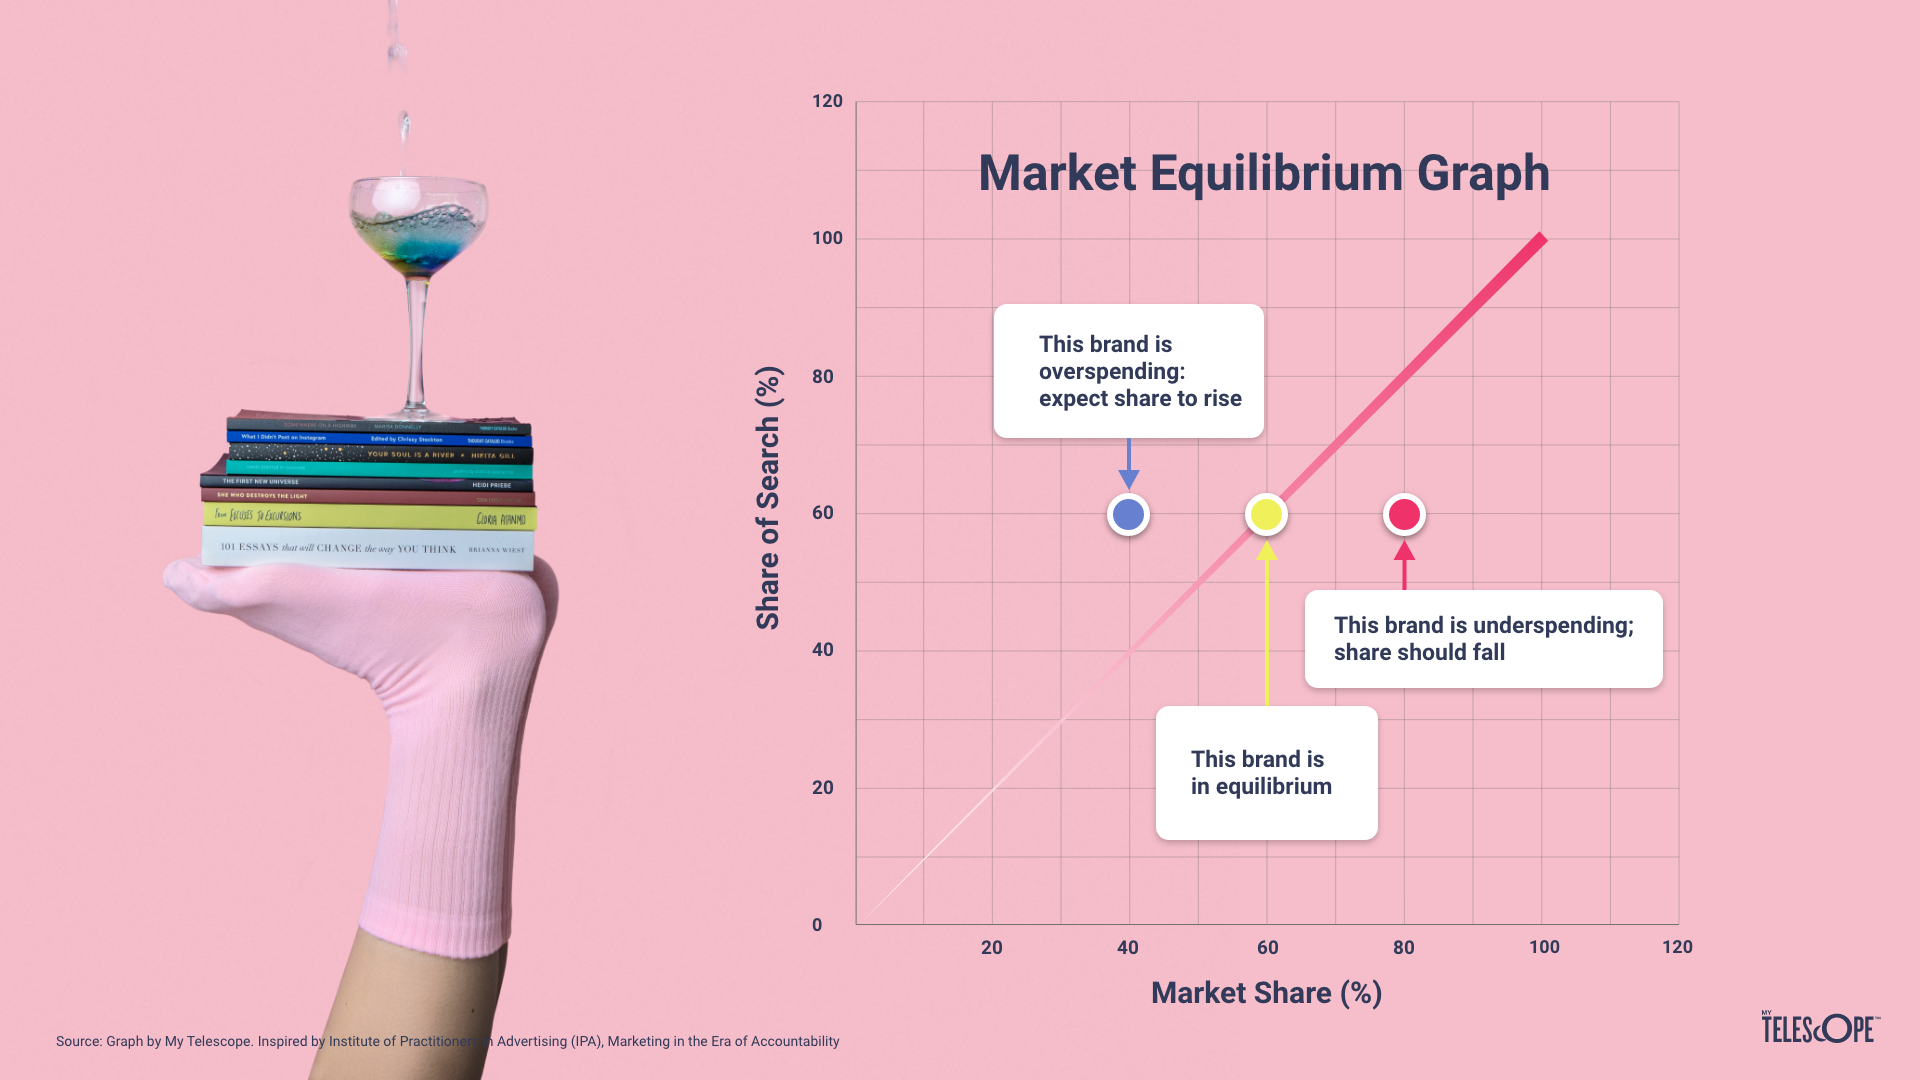
With an increased Share of Search, your competition is naturally likely to see their Share of Market reduce, as it follows in line with the market equilibrium. Is the focus then to create excess Share of Search?
EXCESS SHARE OF SEARCH (ESOS)
Market Share / Share of Search * ESOS = Future market share growth.
Your brand has a 20% market share but enjoyed 30% of the total search frequency last month. Well done! you have +10 ESoS and we know that translates into X% of market share growth in your category per year.
Of course a number of factors such as the size of the competition, price points and quality of your campaigns will contribute to your overall success in driving ESOS and gaining market share.
Read more on the subject at www.mytelescope.io
Share of Search for FMCG

Making the board smile: the money metrics" was the title of the roundtable at Festival of Marketing set out to show how the right metrics will get marketing to be more credible in the C-suite. Marketers have no shortage of metrics, but unfortunately not many the board can instinctively relate to. The lack of a clear connection to commonly used business metrics is a problem. Our latest data within an FMCG category showed a clear and strong correlation in the movements between share of search and market share. Now that's a metric C-level can relate to!
The ultimate guide to understanding Marketing effectiveness
“By measuring marketing effectiveness you are able to track how the sum of all activities comes together to make or break a brand. “
We are experiencing a data-hype within marketing, however this has come with a focus on what has been easy to measure (short term sales activation) which has led to long term brand building being neglected. Even though long term brand building is proven to give more loyal customers, a more sustainable brand and even larger sales.
To combat this the measure of marketing effectiveness has come to light to measure the impact of marketing communications strategies on the brand as a whole.
By measuring effectiveness you are able to track how the sum of all activities comes together to make or break a brand.
For true marketers what this means is that you can continue making memorable brand building marketing communications while also being able to prove your worth in numbers in front of short sighted company boards and nervous clients.
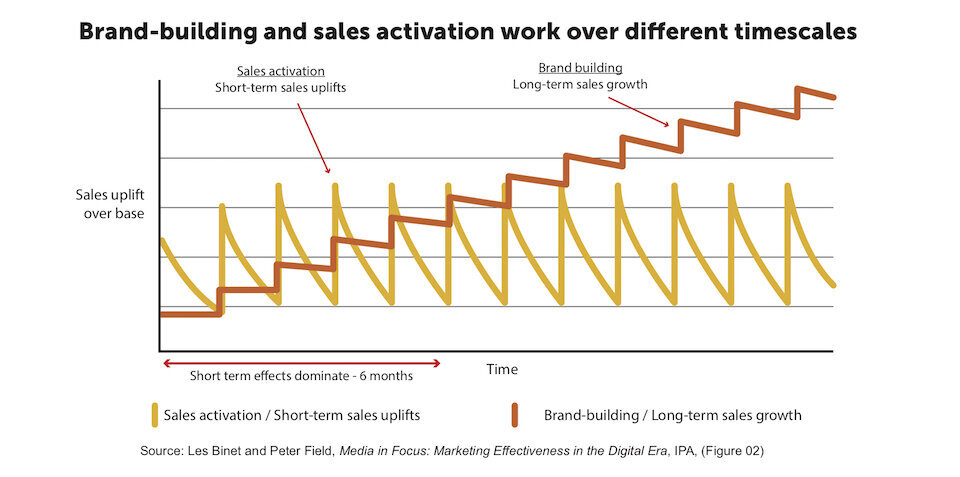
Source: Les Binet & Peter Field
So how do you actually measure marketing effectiveness in a well… an effective way?
Marketing and effectiveness pioneers such as Les Binet and Peter Fields have devoted their time to studying the relation between effectiveness and our digital age’s vast bank of online data. They found that effectiveness can be directly linked to search behavior and volume as well as the sentiment of what is being said of brand and in what amount.
We interpreted theirs and many more’s findings into these key measurements for you to follow:
Share of search: To what degree is a brand’s marketing communication creating interest relative to their competitors?
Share of search has been determined by marketing academia as well as Google themselves as an effective measurement of market share in a digital age.
How is this possible? Two parts: first, people who wish to purchase your product/service search for it online, therefore any demand-generating marketing initiative should lead to an increase in your share of search. Secondly, share of search also takes into account your current customers as people are more likely to want information on something they already have "(if you own an Apple laptop, you’re more likely to ask questions about it").
Share of earned media: To what degree is a brand’s marketing communication resulting in an increase in people talking about your brand in relation to your competitors?

So does this mean if people talk about my brand that more people will buy from me?
Well yes and no. Les Binet says that: “‘The brands that people talk about most on social media are the ones they’re least likely to buy”. For example, in the car market the brands that people talk about most are expensive luxury brands: Porsche, Ferrari, Lotus.
People don’t talk about Ford very much on social media, and certainly not Kia or Hyundai, but those are the brands they buy.’
However, what we do know is that share of earned media is proof of creative marketing communications.
This is built on the assumption that creative marketing communications leads to more people talking about said brand
Search and sentiment trend:
The problem with only measuring share of search and share of earned media is that it doesn’t take into account anomalies such as scandals and viral breakthroughs, Volkswagen would be deemed to have a huge spike in their market share as both people were searching and discussing Volkswagen quite radically during the 2015 emission scandal whereas we know that this was no positive event for them.
To be able to neutralize these types of anomalies Search and Sentiment trend has been developed by My Telescope. The index is an aggregate of search volume, social media & media sentiment, and volume of mentions.
By aggregating share of search and share of earned media and weighing this curve with the sentiment of what was being said about the company we became able to more accurately measure the long and short of brand building and marketing communications effectiveness.

Source My Telescope

What creates a strong Share of Search?
A strong Share of Search is created by having a strong brand, and the recipe for a strong brand is the million dollar question for marketers. A unique recipe for brand building based on the Long and the Short of it:
(Recipe created by Les Binet)
Share of Search is based on two factors:
Your brand’s base level interest:
The size of your current customer base
Your brand strength
The effects of marketing:
Short term ad effects
Long term ad effects
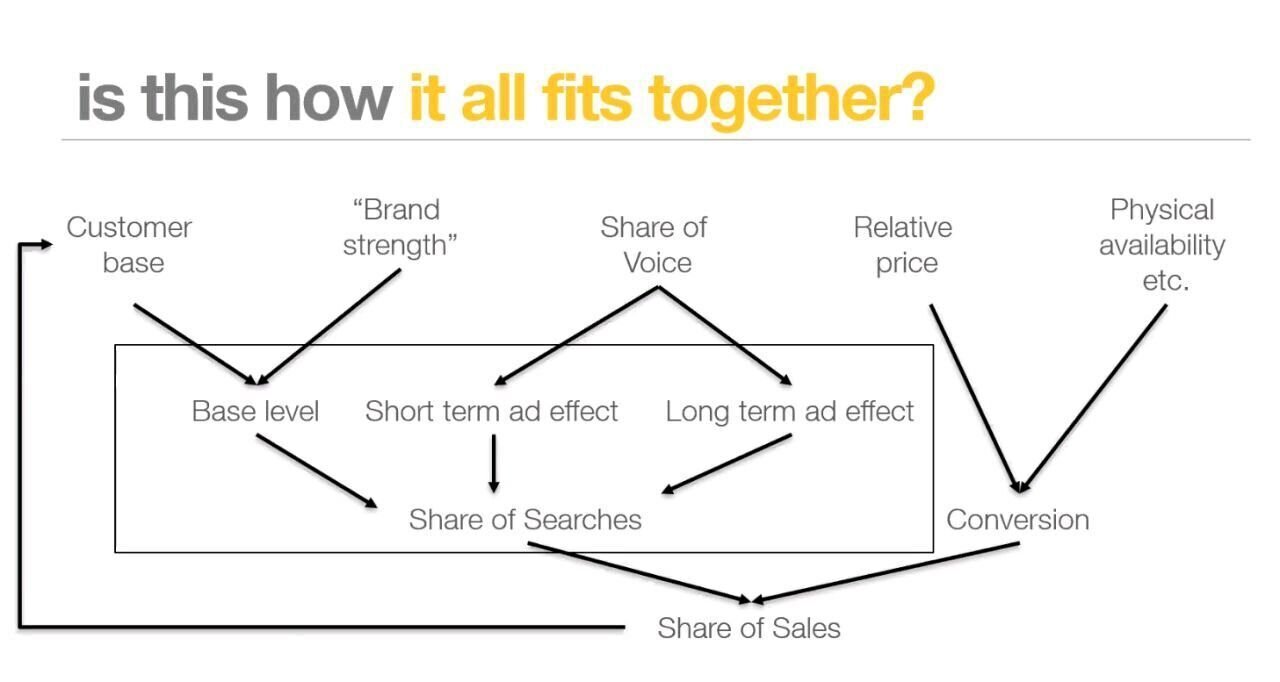
@Les Binet