
10 lessons on how to track your brand with Share of Search

Share of Search is great tool to track brand strength. But there are many aspects to keep in mind. Here are our best tips.
RESEARCH RELAY
Analysts and researchers around the globe may have the chance to share how they explore new trends and follow brands in the data era. The writer passes the baton on to someone they are inspired by.
The baton is now in the hands of Share of Search Council member Robert af Klintberg Ryberg:
“Share of Search” (SoS) is an excellent method for analyzing customer interest and predicting sales and market share changes. However, as I have written about before, the technique has some challenges. But applying a few learnings can easily make SoS work at its best.
What can Share of Search tell us?
We at Kapero have been using Share of Search in several cases when analyzing all aspects of a marketing department, to find opportunities to improve organization, processes, and effectiveness. We have learned that it is a most useful metric.
1. There is a clear link to future sales in the short term. An uptick in search interest points to increased sales within three weeks to six months, depending on how fast-moving the category is.
2. There is a clear correlation to brand strength slightly longer term. We’ve seen this in every project we’ve applied “Share of Search” to. Furthermore, there is a correlation between a change in brand strength and market share. We have so far not seen any examples that contradict this. So, we could call this “Share of Brand”.
Short-term impact on sales (1) is perhaps most valuable for forecasting supply.
Instead, we are primarily interested in growth within the category and how market share changes. Therefore, we look mainly at how the interest for the brand changes (2). But how best to study this with “Share of Search”?
Here are ten lessons we have learned:
· It is the long-term trend that is important to study to see if there are indications that the brand (market share) is growing or if there are indications to the contrary.
· Like regular brand measurements, real change happens in 1-2 years. You, therefore, don’t need to update the measure very often.
· Study averages over time (full-year, half-year or possibly quarterly). Variations and rapid fluctuations make it difficult to read the graphs and the variations occur for many reasons that are hard to analyze and interpret. Rapid fluctuations are usually unimportant for growth and change in market share towards a strategic time horizon. Averages also increase the reliability of the somewhat coarse data Google provides.
It is important to consider the relative change, not just the change of percentages in the diagram.
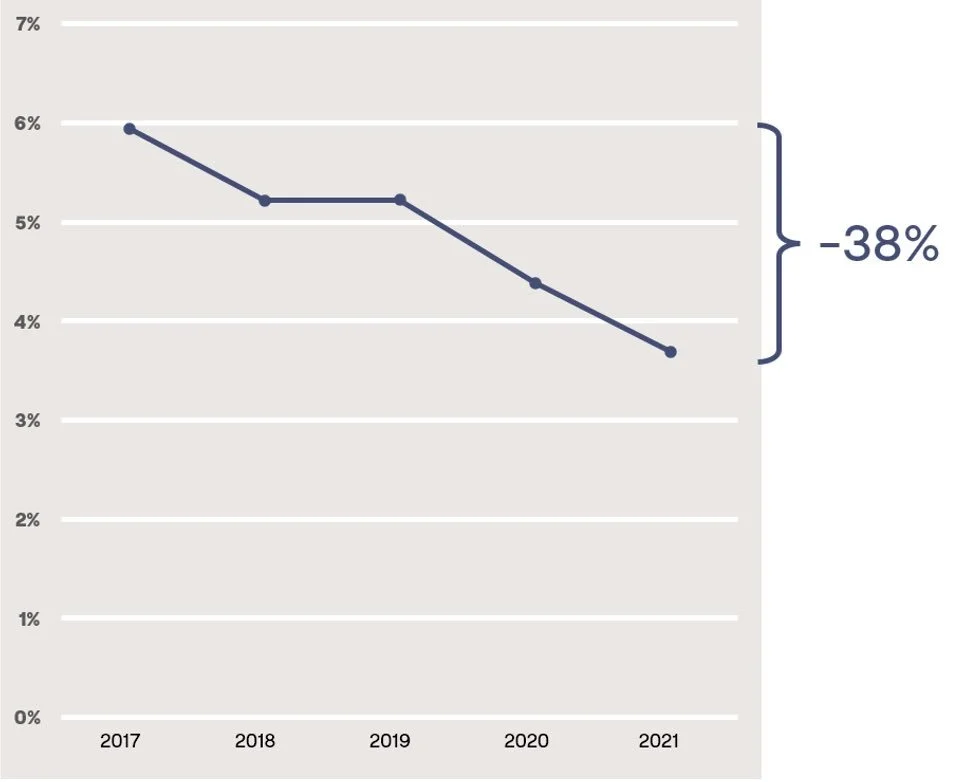
Focus on your brand’s relative change. An increase from 1% to 2% in Share of Search may seem insignificant but is, in reality, growth by 100%! Or a decrease from 6% to 3,7% is a relative loss of 38 % as in the image above.
Select the competitors against who you want to study your share. This can often be difficult, primarily if your competitors operate in multiple categories. Therefore, define a clear category. Buy you may want to follow multiple such definitions.
If competitors also operate in other categories and you don’t want to contaminate your measurement with their strength (market share) in those other categories, you can combine the brand name with the product type you have in common. For example, combine “Bosch” and “washing machine” and compare with “Samsung” and “washing machine”.
If the product category is tricky to define, you can even combine the brand with the name of actual products. Be aware that you also need to do this in the same way for the competitors you are comparing with to get reliable data.
You can add up search volumes for several such combinations of terms. This can be a good method of narrowing down to a specific product category and increasing search volume so that it becomes reliable.
Try out different set-ups. You can always create comparisons with various competitors and possibly word combinations, with varying selections of categories, geographic regions, periods, and anything else you want to study. Test where you get good, reliable data, what competitors to disregard and what terms to combine. You can always change your mind later since you have the historical data is there for you and all your competitors.
Consider significant adverse search interest. This is mainly done to correlate major adverse events (e.g. media scandals) with visible changes in the SoS. Here, quarterly or monthly averages may need to be studied to assess the impact. In our experience, it takes pretty significant events to impact SoS for established brands. Research also shows that over time these adverse events usually have a little sustainable impact on the brand.
Also, remember to avoid the pitfalls - there are quite a few. Especially for smaller brands (see my previous article). https://www.linkedin.com/pulse/share-search-rarely-savior-many-brands-hope-af-klintberg-ryberg/
Now – go on exploring your Share of Brand!
