
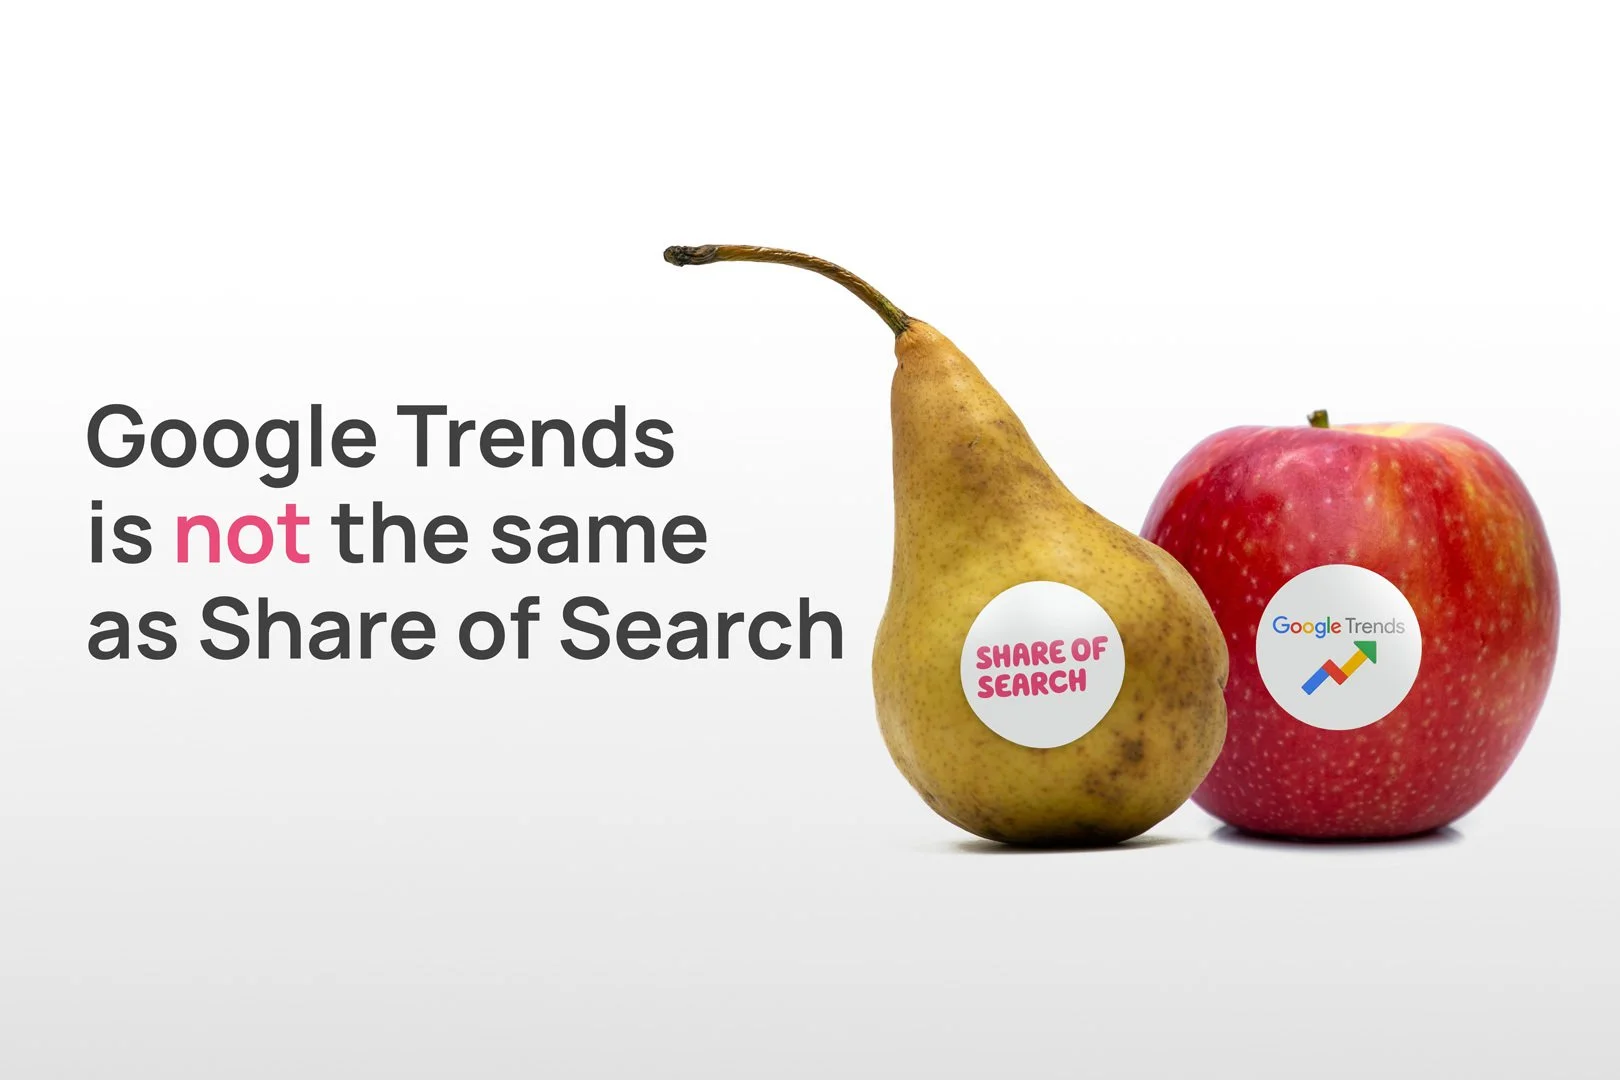
Share of Search is not Google Trends
A common misconception on Share of Search
The concept of Share of Search is gaining popularity, but with new concepts also come new misconceptions. In this article we’ll debunk one, but let’s s make sure we all start from the same page.
The idea behind Share of Search is simple: we compare how many times people actively thought about us in comparison to other brands, knowing from Byron Sharps studies that this overflow of mental availability will lead to increased sales given our product or service is easily accessible.
That’s it? Yep, and most people will use the simplest tool in the world to get that overview: Google Trends…..which is exactly leading to the biggest misconception with this new metric.
The data of Google Trends is useful to identify changes in search volumes between brands within shorter periods and mainly to see how quickly a new trend picks up. However, it is not ideal for finding correlations towards sales. Those who dive deeper into it and actually start investigating the correlations in depth, often are left with little to find. Google Trends, if anything is therefore better to investigate the reaction for marketing campaigns and trends, instead of relation to sales.
Here is why Google Trends isn’t the ideal dataset to run market share correlation:
Indexed:
The Google Trends results are indexed, meaning a change in search volume from one week to another can completely shift the historical values. Furthermore, the selection between the brands is also very important.Randomised:
The data that are shown are based on samples taken from the time period you selected. This makes the data unstable as the exact same search merely 10minutes apart can lead to totally different results.Keyword selection:
Google Trends will request whether you want to look at the search term or the categorisation. For example Unilever as search term of “retail”. This selection will also generate different results. Furthermore, our research has shown that rather seldomly the direct brand name will show any strong correlation to the sales results or market share.
Use Monthly search levels
Instead, the use of monthly search volumes proves to be far more effective and have a much higher frequency to show correlation. Especially when being able to select various keywords to look for the correlations. Something that can easily be obtained by various tools including the Share of Search analytics tool My Telescope.
But wasn’t the original research done with Google Trends data?
The original research by both Les Binet and James Hankins was indeed done using Google Trends data, their approach was different from what most people discovering Share of Search do. Here are the main differences:
Long time series:
Les’ automotive research, kicking off Share of Search, was done over a period of 13 years. This meant he had both search and sales figures for a rather extended period. Most people using Google trends now, don’t have the sales numbers over such long time periods.12 month rolling averages:
Given the long time periods they were able to use 12 month rolling averages, taking out most fluctuations and more stable lines.They looked at long term trends:
Unlike most people using Google Trends and expecting to find similar curves in both search trends and sales, Hankins and Binet looked at long term trend lines in both data sets that showed clear correlation.
So if you want to look for correlations between Share of Search and market share or sales on shorter time series: use search volumes, select the right search words and look at trend lines.